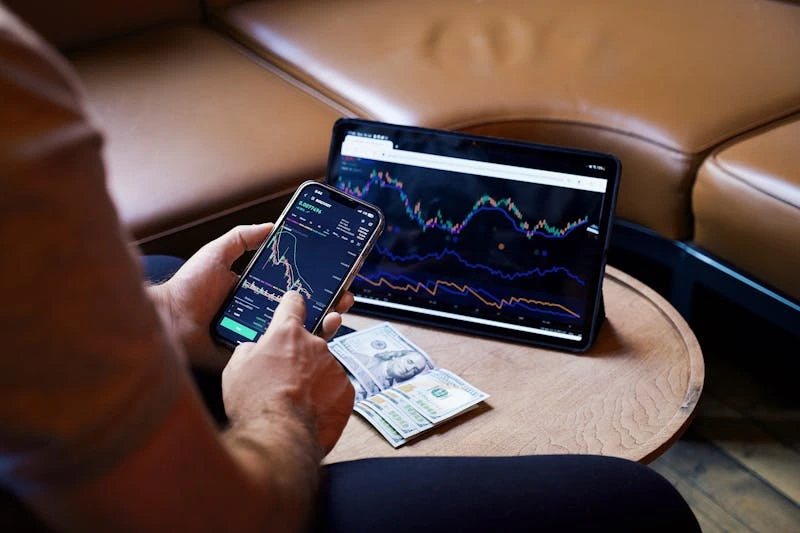
Candlesticks are one of the most widely used tools in technical analysis. They help traders and investors understand price movement, market sentiment, and buyer–seller behavior without relying on complex indicators.
By understanding what is a candlestick and the true candlestick meaning, beginners can read charts more confidently and avoid treating price movement as random noise.
What Is a Candlestick?
A candlestick represents price behavior over a specific time period. It shows four key prices: open, high, low, and close. Together, these prices summarize how buyers and sellers interacted during that period.
In a chart, candlesticks translate raw price data into visual form. This makes market behavior easier to interpret quickly.
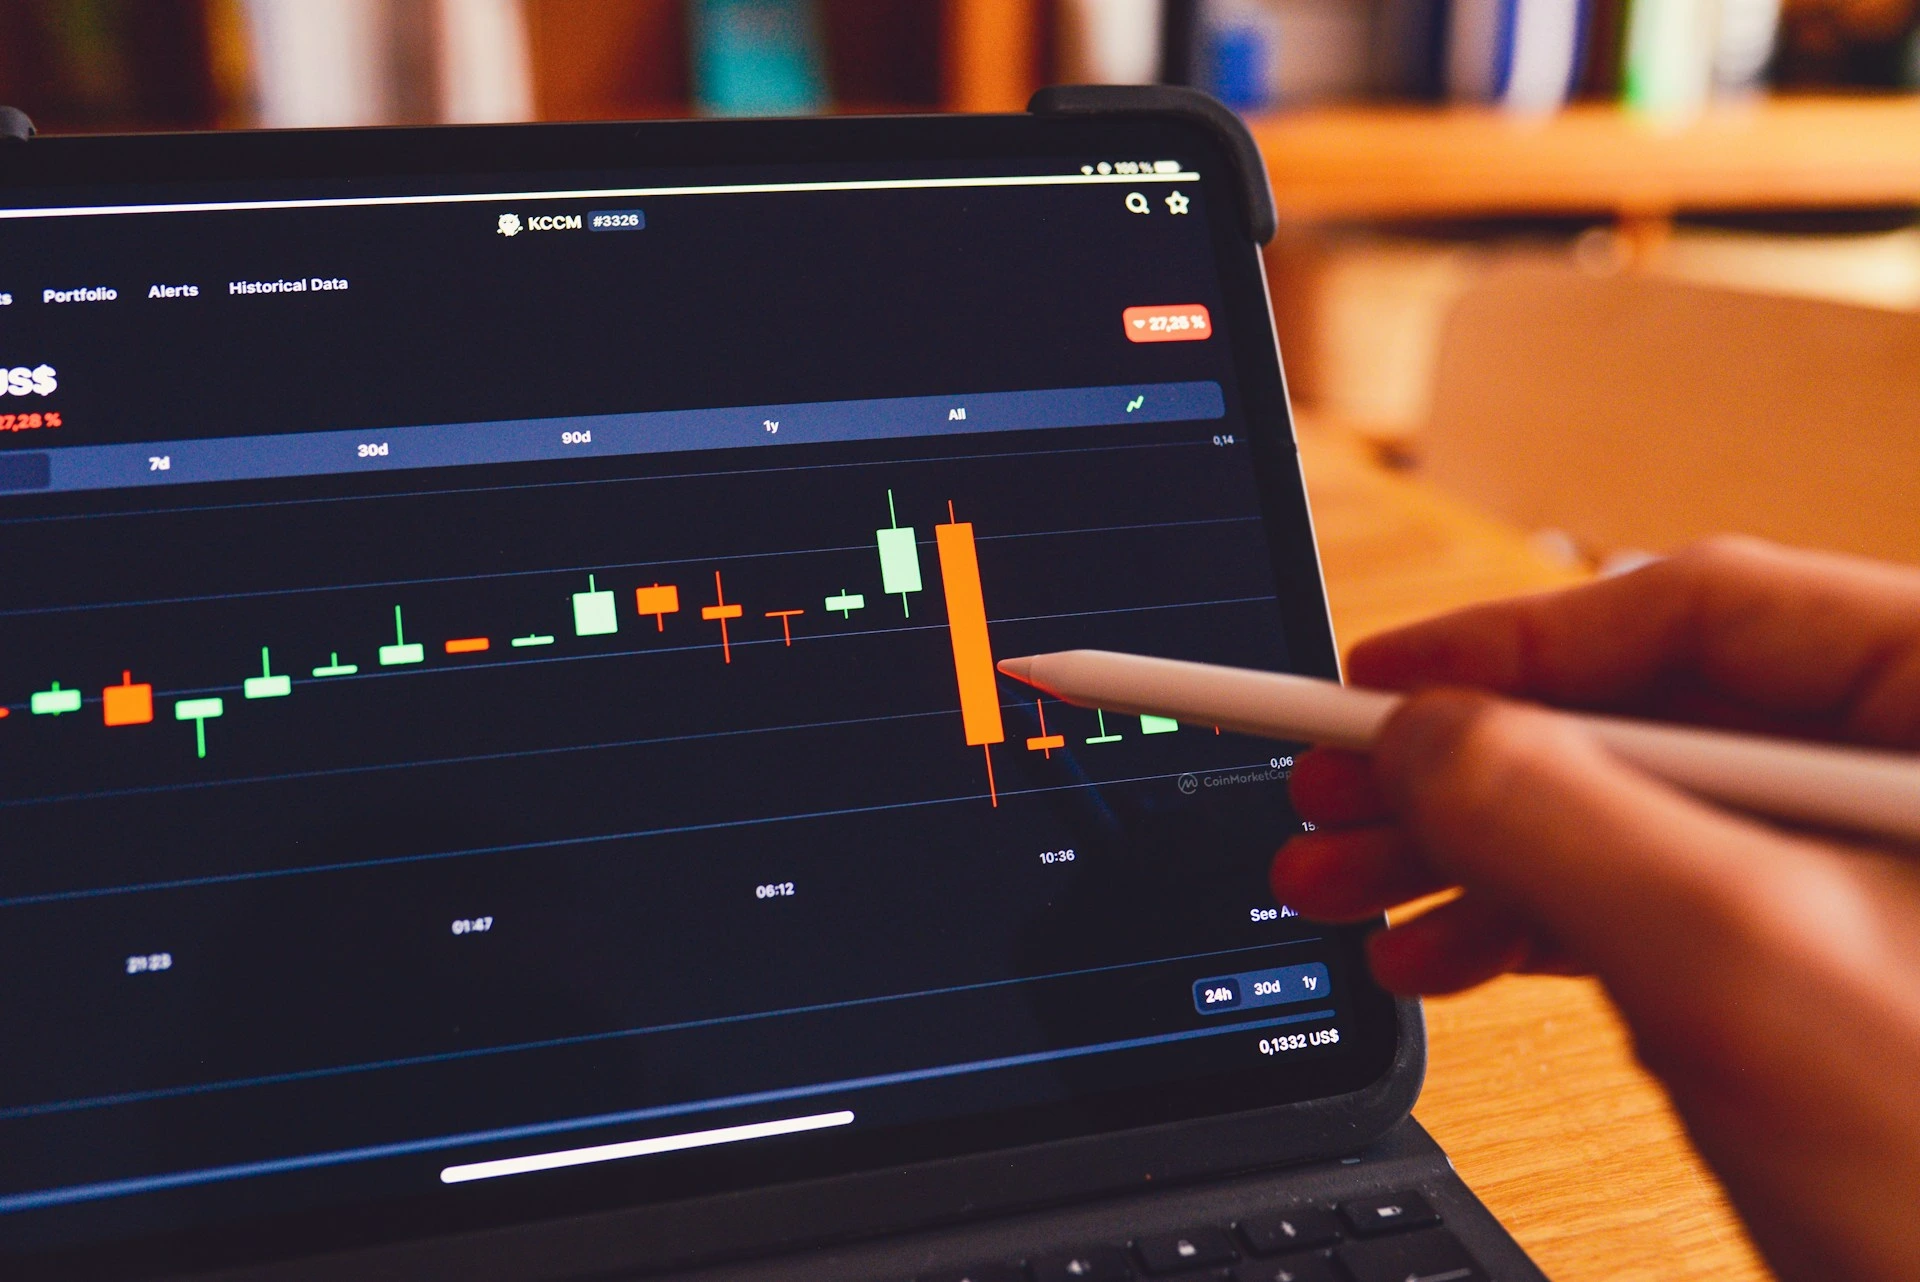
Parts of a Candlestick
Every candlestick follows the same structure.
The body
The body represents the distance between the opening and closing price. A larger body suggests stronger conviction from buyers or sellers.
The wick or shadow
The wick shows how far price moved beyond the open and close. Long wicks often indicate rejection or failed attempts to push price higher or lower.
Bullish and bearish candlesticks
A bullish candlestick closes above its open. A bearish candlestick closes below its open. Color helps visualization, but structure matters more than color.
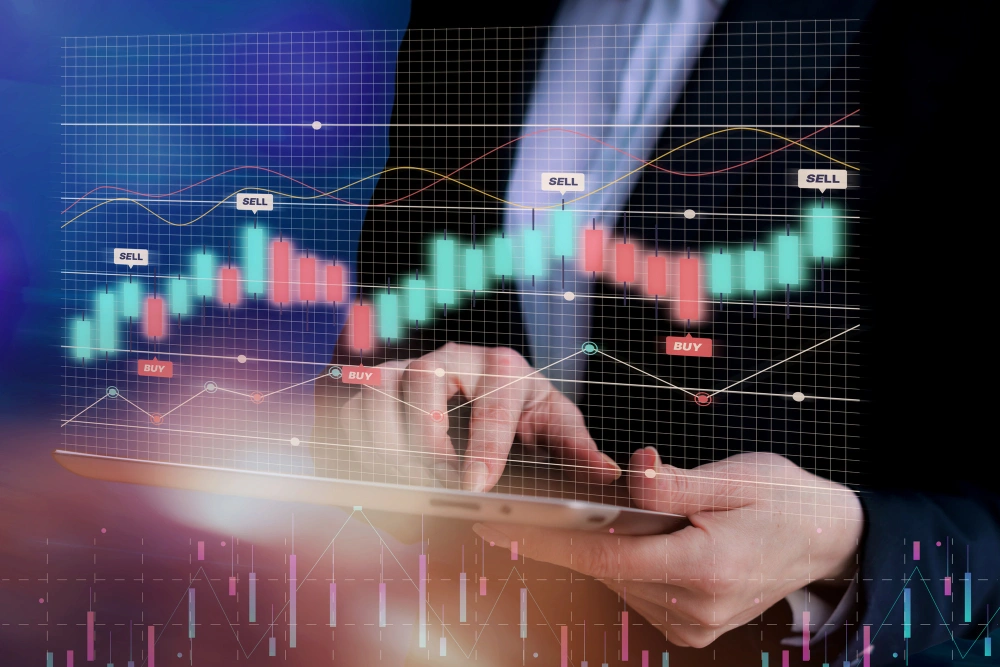
What Candlesticks Reveal About Market Behavior
Candlesticks reflect market psychology.
Momentum and strength
Large bodies with small wicks signal strong momentum. This often appears during sustained trends.
Indecision and balance
Small bodies with long wicks suggest indecision. Neither buyers nor sellers have clear control.
Rejection and key levels
Long upper or lower wicks show where price was rejected. These areas often act as important support or resistance levels.
Candlesticks Across Timeframes and Market Context
Candlesticks work across all markets and timeframes.
Timeframe flexibility
Candlesticks can represent minutes, hours, days, or weeks. The meaning remains consistent regardless of timeframe.
Reliability by timeframe
Higher timeframes tend to provide more reliable signals. Lower timeframes contain more noise and false signals.
Importance of context
Candlesticks should always be read within trend and structure. Isolated candles can be misleading without context.
Common Mistakes When Using Candlesticks
Misuse often leads to poor decisions.
Reading single candles in isolation
One candlestick does not define a trend or reversal. Patterns gain meaning only within context.
Over-relying on candlestick patterns
Candlestick patterns describe behavior, not certainty. They should not be treated as guarantees.
Ignoring market environment
Candlestick signals behave differently in trends versus ranges. Ignoring this leads to false expectations.
Practical Example of a Candlestick
A stock opens at 100 and closes at 108. During the session, it trades as high as 112 and as low as 98.
The candlestick body shows strong buying pressure. The wicks reveal rejection at both extremes.
This tells you buyers were in control, but resistance existed.
Candlesticks for Traders and Investors
Candlesticks are not only for short-term traders.
Use for entry timing
Investors use candlesticks to improve entry timing. This helps avoid buying during short-term exhaustion.
Use for risk awareness
Certain candlestick behaviors signal increased volatility. This informs position sizing and patience.
Use for sentiment reading
Candlesticks visually represent fear, greed, and hesitation. They provide insight beyond numbers.
Conclusion
A candlestick is a visual summary of price movement over a specific time period. By understanding what is a candlestick, its structure, and what candlesticks reveal about market behavior, traders and investors gain a clearer view of price action.
Candlesticks do not predict the future, but they help interpret what is happening now. When combined with context, trend awareness, and risk management, they become a foundational skill for reading markets.
When analyzing charts in the Gotrade app, recognizing candlestick behavior across timeframes can help you better understand price movement and make more informed investing or trading decisions.
FAQ
What is a candlestick in trading?
A candlestick shows the open, high, low, and close price for a specific time period.
Are candlesticks only useful for traders?
No. Investors also use candlesticks to understand price behavior and improve timing.
Do candlesticks work on all markets?
Yes. Candlesticks apply to stocks, ETFs, forex, and other markets.
Is one candlestick enough to make a decision?
No. Candlesticks should be read within trend and market context.
Reference:
Investopedia, Candlestick Chart, 2026.
Spotfire, Understanding Candlesticks Chart, 2026.